목차
Njmon 이란?

njmon 는 nmon 과 비슷하지만 더 많은 성능 및 구성 데이터를 수집하고 JSON 형식으로 출력하고 해당 데이터를 데이터베이스(if. InfluxDB, Prometheus)에 입력하는 기능을 수행합니다.
주로 nmon 에 익숙하여 다른 Metric 을 사용하기 힘들거나, Exporter 를 설치하는데 어려움이 있는 CASE 에서 사용하기 좋은 Tool 일 것 같습니다.
Architecture

위와 같은 구조로 njmon 데이터를 수집 받고 Telegarf 가 마치 Node Exporter 처럼 Metric 을 Prometheus 로 전달하는 구조로 구성합니다.
Telegraf config
이번 글에서 사용한 테스트 시스템은 Rocky Linux 8 이며 아래 문서를 참고 하여 Telegraf 를 구성하였습니다.
(https://docs.influxdata.com/telegraf/v1.21/introduction/installation/?t=RedHat+%26amp%3B+CentOS)
아래와 같이 Repository 를 추가합니다.
cat <<EOF | sudo tee /etc/yum.repos.d/influxdb.repo
[influxdb]
name = InfluxDB Repository - RHEL \$releasever
baseurl = https://repos.influxdata.com/rhel/\$releasever/\$basearch/stable
enabled = 1
gpgcheck = 1
gpgkey = https://repos.influxdata.com/influxdb.key
EOF
dnf 를 통해 Package 를 설치합니다.
$sudo dnf install telegraf -y
/etc/telegraf/telegraf.conf 를 아래와 같이 수정합니다.
[[outputs.prometheus_client]]
    listen = ":8088"
    metric_version = 2
    path = "/metrics"
    expiration_interval = "120s"
    string_as_label = false
[[inputs.socket_listener]]
    service_address = "tcp://:8888"
    data_format = "influx"
    read_buffer_size = "256KiB"
    read_timeout = "2s"
기본적으로 들어간 [[outputs.XXXXXX]] config 값은 제외해야지 정상적으로 서비스가 기동됩니다.
$ sudo systemctl enable --now telegraf
서비스가 정상적으로 기동되면 http://localhost:8088/metrics subpath 로 metric 이 expose 됩니다.
Njmon config (nimon)
http://nmon.sourceforge.net/pmwiki.php?n=Site.Njmon 에서 Latest Release 를 확인 할 수 있고,
https://sourceforge.net/projects/nmon/files/ 제공 중인 All Release 를 확인 할 수 있습니다.
OS Version 과 CPU Type 를 확인하여 njmon 을 다운 받습니다.
[root@chhan-influxdb ~]# unzip njmon_linux_binaries_v78.zip
[root@chhan-influxdb ~]# cp njmon_RHEL8_x86_64_v78 /usr/local/bin/njmon
[root@chhan-influxdb ~]# chmod 775 /usr/local/bin/njmon
[root@chhan-influxdb ~]# chown root:root /usr/local/bin/njmon
[root@chhan-influxdb ~]# ln -f /usr/local/bin/njmon /usr/local/bin/nimon
위와 같이 njmon 를 설치하고 아래 명령을 통해 nimon 을 기동하고 telegraf 로 데이터를 전송하도록 설정합니다.
$ sudo nimon -s30 -c1440 -w -D -P -i localhost -p 8888
nimon 이 정상적으로 telegraf 로 데이터가 전송이 된다면, http://localhost:8088/metrics 에서 아래와 같이 metric 이 확인 할 수 있습니다.
$ curl -s localhost:8088/metrics
...
# HELP cpu_total_guest Telegraf collected metric
# TYPE cpu_total_guest untyped
cpu_total_guest{architecture="x86-64",host="chhan-influxdb",mtm="OpenStack-Compute",os="Rocky",serial_no="a9221572-6655-4dab-b7ab-b5ec8831ab35"} 0
# HELP cpu_total_guestnice Telegraf collected metric
# TYPE cpu_total_guestnice untyped
cpu_total_guestnice{architecture="x86-64",host="chhan-influxdb",mtm="OpenStack-Compute",os="Rocky",serial_no="a9221572-6655-4dab-b7ab-b5ec8831ab35"} 0
# HELP cpu_total_hardirq Telegraf collected metric
# TYPE cpu_total_hardirq untyped
cpu_total_hardirq{architecture="x86-64",host="chhan-influxdb",mtm="OpenStack-Compute",os="Rocky",serial_no="a9221572-6655-4dab-b7ab-b5ec8831ab35"} 0
# HELP cpu_total_idle Telegraf collected metric
# TYPE cpu_total_idle untyped
cpu_total_idle{architecture="x86-64",host="chhan-influxdb",mtm="OpenStack-Compute",os="Rocky",serial_no="a9221572-6655-4dab-b7ab-b5ec8831ab35"} 99.634
...
Prometheus config
Prometheus Scrape Config Target 을 아래와 같은 형식으로 설정합니다.
$ cat prometheus.yml
global:
  scrape_interval:     15s # Set the scrape interval to every 15 seconds. Default is every 1 minute.
scrape_configs:
  - job_name: 'prometheus'
    static_configs:
    - targets: ['localhost:9090']
  - job_name: 'node_exporter'
    static_configs:
    - targets: ['localhost:9100']
  - job_name: 'njmon'                           <<<
    static_configs:                             <<<
    - targets: ['192.168.1.18:8088']            <<<
Prometheus 에서 정상적으로 scrape 이 되면 Prometheus 에서 Metric 이 확인됩니다.


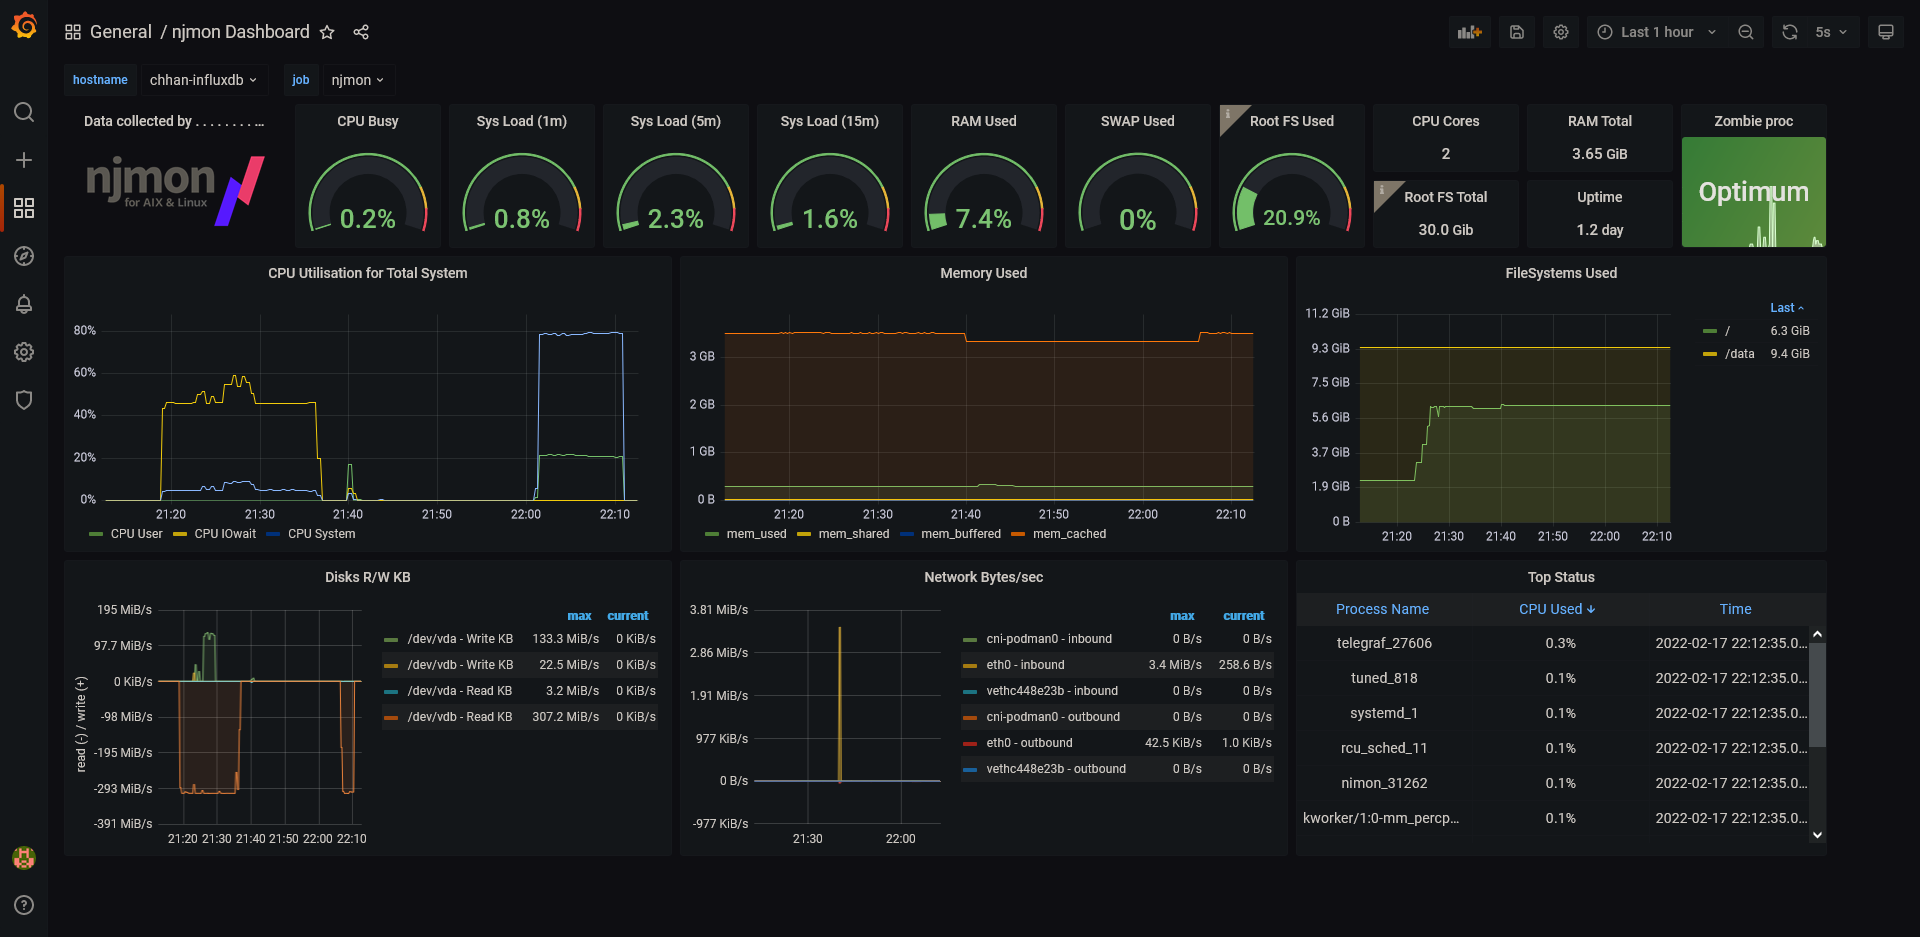
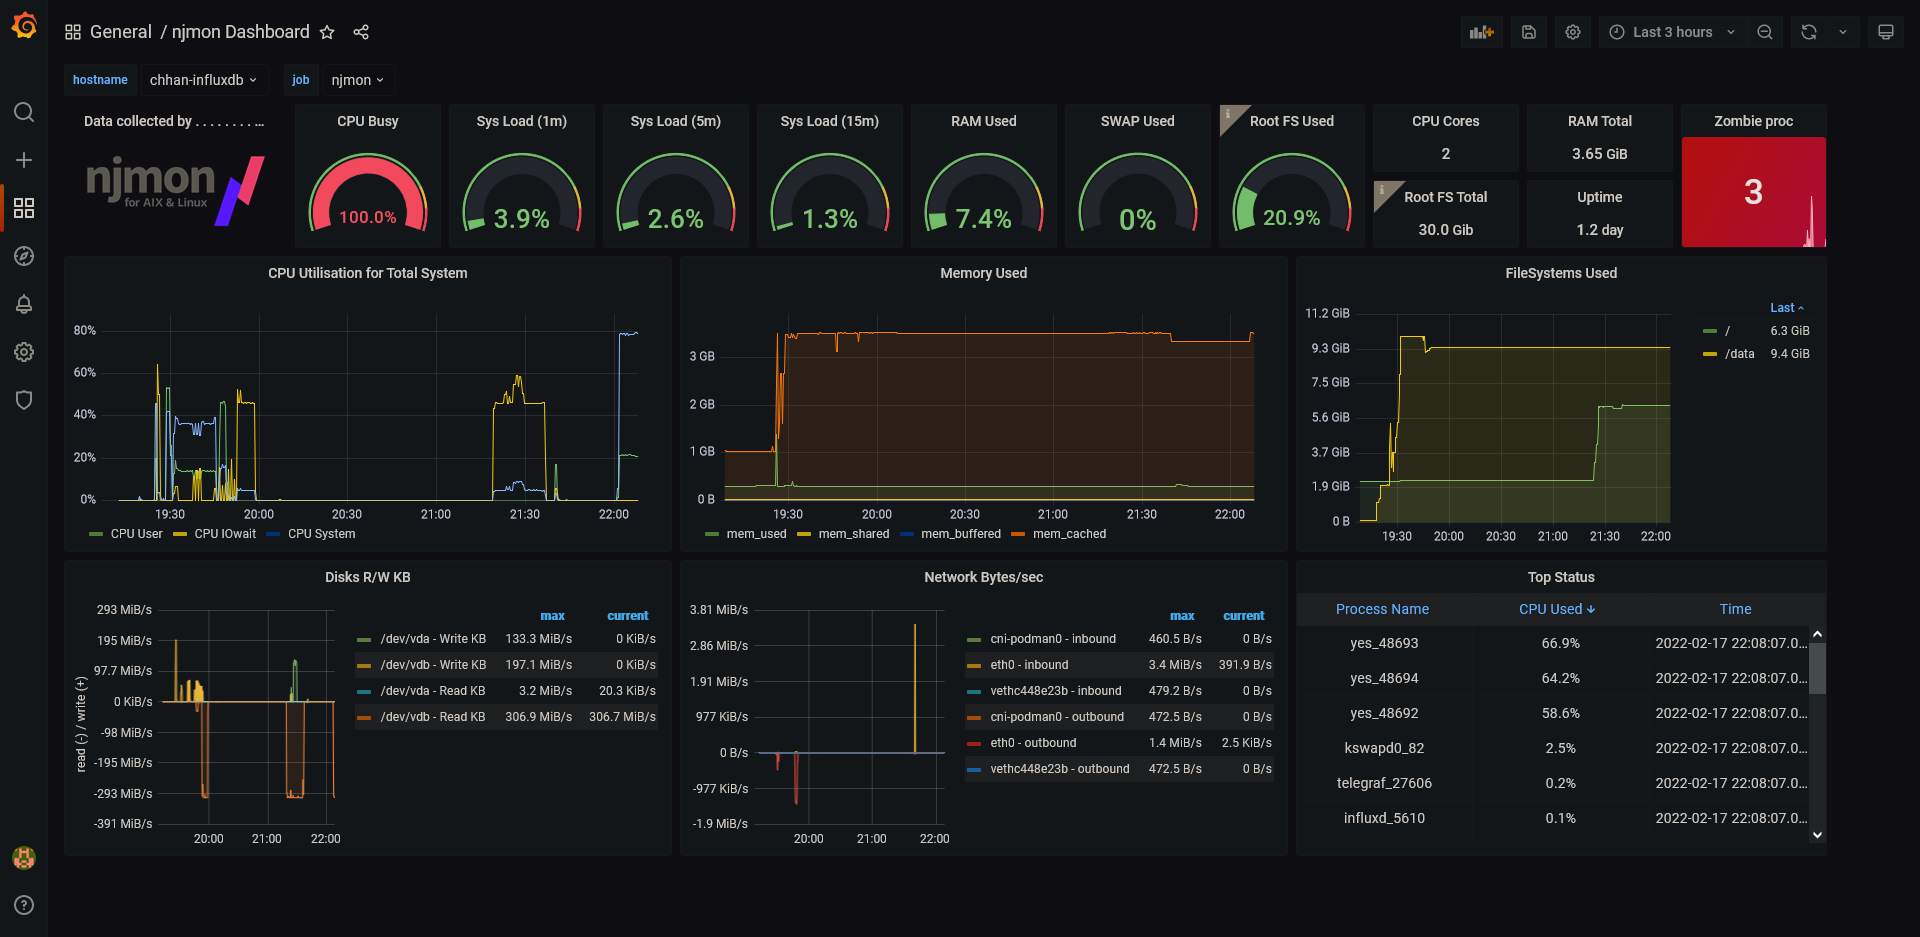
Grafana Dashboard
기본적으로 njmon 은 Grafana Dashboard 를 따로 제공 하지 않습니다.
그리하여 아래와 같이 njmon 을 통해 Dashboard 를 사용 할 수 있도록 만들었습니다.
Linux System 에서 사용 할 수 있도록 만들었고 https://grafana.com/grafana/dashboards/15776 에서
Copy ID 를 이용하여 Import 가 가능합니다.